Introduction
Modern receiving systems must often process very weak signals, but the noise added by the system components tends to obscure those weak signals.
Sensitivity, bit error ratio (BER) and noise figure are system parameters that characterize the ability to process low-level signals.
Noise figure is not only suitable for characterizing the entire system but also the system components such as the pre-amplifier, mixer, and IF amplifier that make up the system.
Once the noise figure is known system sensitivity can be easily estimated from system bandwidth.
Noise figure is often the key parameter that differentiates one system from another.
The reason for measuring noise properties of networks is to minimize the problem of noise generated in receiving systems.
One approach to overcome noise is to make the weak signal stronger.
This can be accomplished by raising the signal power transmitted in the direction of the receiver, or by increasing the amount of power the receiving antenna intercepts.
There are limitations to these approaches. Raising antenna gain usually means larger antenna. Raising the transmitter power are usually limited by government regulations, engineering considerations or economical limitations.
The other approach to overcome the noise problems generated in the system components is to minimize the noise generated within receiver components.
We can use noise measurements to assure that the added noise is minimal.
Once noise get added to the signals, receiver can no longer distinguish noise in the signal frequency band from legitimate signal fluctuations.
The signal and noise get processed together and will be hard to distinguished.
The importance of noise control
The signal-to-noise (S/N) ration at the output of receiving systems is a very important parameter in communication systems.
Identifying or listening to radio signals in the presence of noise is difficult. The ability to interpret the audio information will be difficult in the presence of noises.
As the Signal/Noise ratio decreases gradually the Bit Error Ration (BER) increases rapidly and as the result 1's and 0's become hard to determine.
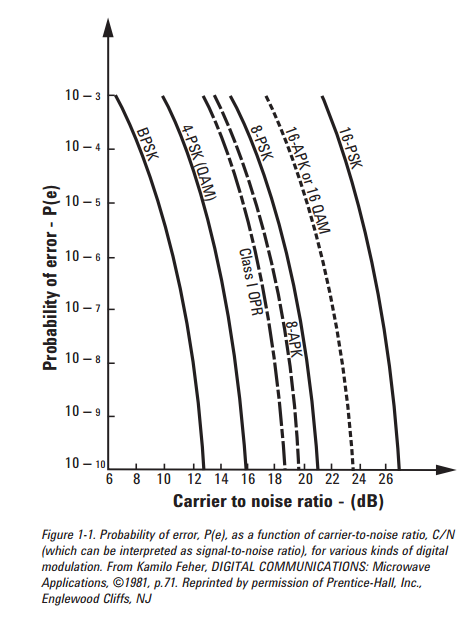
The following figure shows the probability of error vs. carrier-to-noise ratio for several types of digital modulation. It indicates that BER changes by several orders of magnitude for only a few dB change in signal-to-noise ratio.
The output signal-to-noise ratio depends on two factors. The input signal-to-noise ratio and the noise figure.
The noise figure is the difference in decibels(dB) between the noise output of the actual receiver to the noise output of an ideal receiver with the same overall gain and bandwidth when the receivers are connected to match sources at the standard noise temperature (usually 290K).
The input signal-to-noise ratio is a function of the transmitted power, transmitter antenna gain, atmospheric transmission coefficient, atmospheric temperature, receiver antenna gain, and receiver noise figure.
Lowering the receiver noise figure has the same effect on the output signal-to-noise ratio as improving any one of the other quantities.
The following is a scenario that demonstrates the need for lowering the noise figure in the amplifier.
In satellite system noise figure may be particularly important. Consider the example of lowering the noise figure of a direct broadcast satellite (DBS) receiver. One option for improving receiver noise figure is to increase the transmitter power. However, this option can be very costly to implement. A better alternative is to substantially improve the performance of the receiver low noise amplifier (LNA). It is easier to improve LNA performance than to increase transmitter power.
The noise figure of the power amplifier could be measured to insure the acceptability of the noise level before it is installed in the system.
Source of noise
The noise being characterized by noise measurements consists of spontaneous fluctuations caused by ordinary phenomena in the electrical equipment.
Thermal noise arises from vibrations of conduction electrons and holes due to their finite temperature.
Some of the vibrations have spectral content within the frequency band of interest and contribute noise to the signals.
The noise spectrum produced by thermal noise is nearly uniform over RF and microwave frequencies.
The power delivered by a thermal source into an impedance matched load is kTB watts. k is Boltzmann's constant (1.38 x 10^-23 joules/K), T is the temperature in K, and B is the systems noise bandwidth.
Shot noise arises from the quantized nature of current flow. There are also other random phenomena that occur in the nature that are quantized and produce noise in the manner of shot noise.
Some examples of shot noise are the generation and recombination of hole/electron pairs in semiconductors (G-R noise), and the division of emitter current between the base and collector in transistors (partition noise).
These noise generating mechanisms have the characteristic that like thermal noise, the frequency spectra is essentially uniform, producing equal power density across the entire RF and microwave frequency range.
There are many causes of random noise in electrical devices.
Noise characterization usually refers to the combination effect from all the causes in a component.
The combined effect is often referred to as if it all were caused by thermal noise.
Referring to a device as having a certain noise temperature does not mean that the component is making physical temperature. It in fact means that it's noise power is equivalent to a thermal source of that temperature.
Although the noise temperature does not directly correspond to the physical temperature there might be a dependency on temperature in many cases. Some very low noise figures can be achieved when the device is cooled to a temperature below ambient.
There are other types of noise sources which we are not covering here. These noise sources include human-generated interference, ignition, sparks, or undesired pick-up of spurious signals.
A manufacturer of LNAs may have difficulty measuring the noise figure because there is commonly a base station nearby radiating RF power at the very frequencies they are using to make their sensitive measurements. For this reason, accurate noise figure measurements are often performed in shielded rooms.
The concept of noise figure
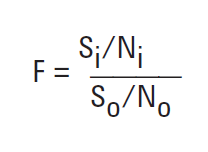
The basic definition of noise figure is the ratio of the signal-to-noise power ratio at the input to the signal-to-noise power ratio at the output.
A perfect amplifier would amplify the noise at its input along with the signal. In other word the a perfect amplifier would have the same signal-to-nose ratio at its input and output. The source of input noise is often thermal noise associated with the earth's surface temperature or with losses in the system.
A realistic amplifier, however, will add some extra noise from its own components and degrade or decrease the signal-to-noise ratio.
A low noise figure means that very little noise is added by the network. The concept of noise figure only fits networks, with one input and one output, that process signals.
Noise figure has nothing to do with modulation or demodulation. It is independent of the modulation format and of the accuracy of modulators and demodulators. Noise figure therefore is a general concept than noise quieting used to indicate the sensitivity of FM receivers or BER used on digital communications.
Once noise is added to the signal the amplifier amplifies signal and noise together and does not change the signal-to-noise ratio.
The figure 1-2(a) shows a situation at the input of an amplifier. The signal is 40 dB above the noise floor. The figure 1-2(b) shows the situation at the output of the amplifier. The amplifier's gain has boosted the signal by 20 dB. It also boosted the input noise level by 20 dB and then added its own noise. The output signal is now only 30 dB above the noise floor. Since the degradation in signal-to-noise ratio is 10 dB, the amplifier has a 10 dB noise figure.
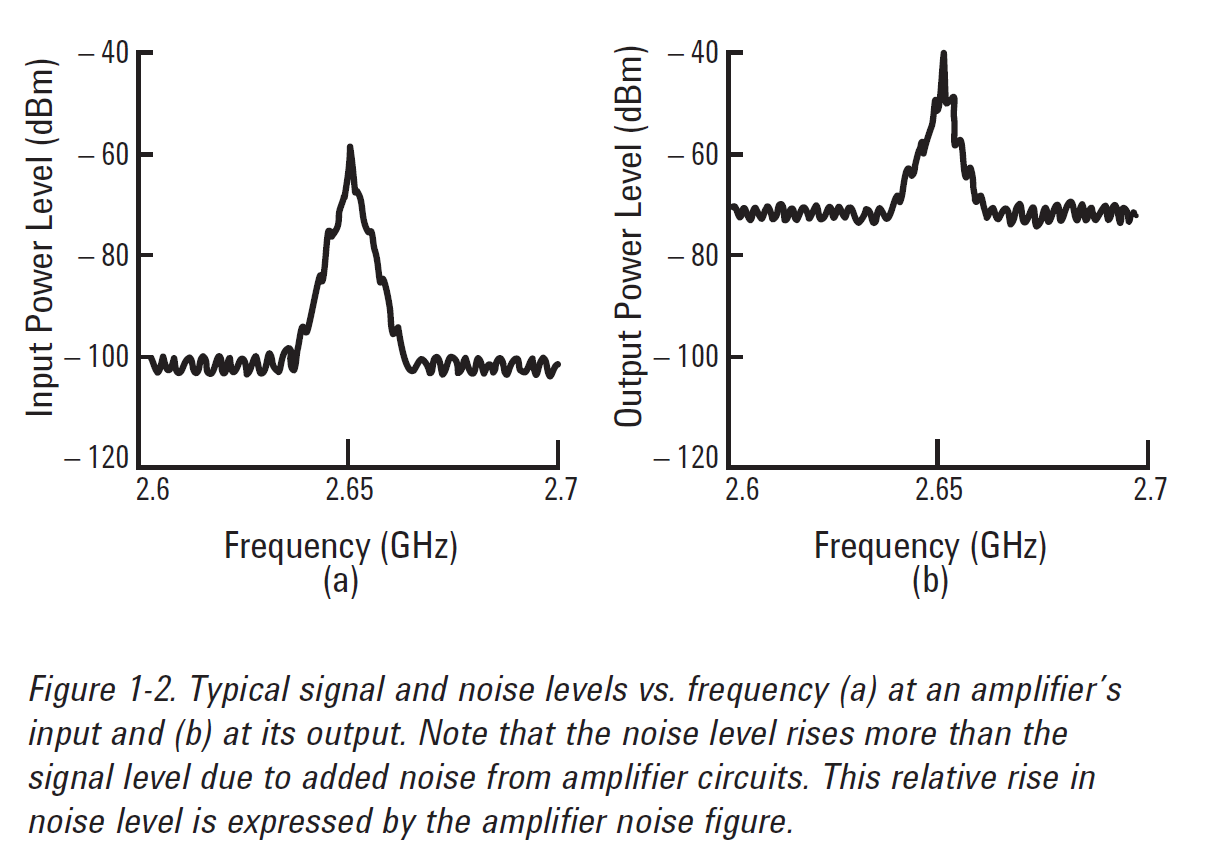
Note that if the input signal level were 5 dB lower (35 dB above the noise floor) it would also be 5 dB lower at the output (25 dB above the noise floor), and the noise figure would still be 10 dB. Thus noise figure is independent of the input signal level.
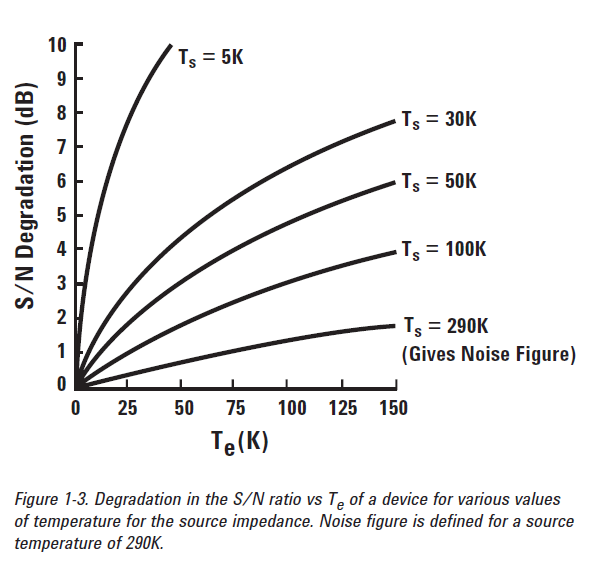
A more precise formula for the noise figure is as the following. The degradation in a network's signal-to-noise ratio is dependent on the temperature of the source that excites the network. This can be proven with a calculation of the noise figure F, Where S_i and N_i represent the signal and noise levels available at the input to the device under test (DUT), S_o and N_o represents the signal and noise levels available at the output, N_a is the noise added by the DUT, and G is the gain of the DUT. Equation (1-2) shows the dependence on noise at the input N_i.
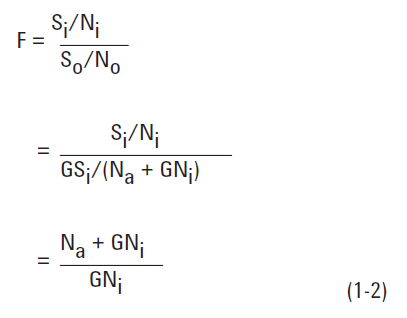
The input noise level is usually thermal noise from the source and is referred to by k(T_o)B. T_o it suggested to be 290K which is equivalent to 16.8 C and 62.3 F. This temperature is close to the average temperature seen by receiving antennas directed across the atmosphere at the transmitting antenna.
The power spectral density kT_o si the even number 4.00 x 10^-21 watts per hertz of bandwidth(-174 dBm/Hz). The IEEE adopted 290K as the standard temperature for determining noise figure. The equation (1-2) becomes
This is the definition of noise figure adopted by IEEE.
Noise figure is generally a function of frequency, but is is usually independent of bandwidth. This is the case as long as the measurement bandwidth is narrow enough to resolve variations with frequency.
Noise powers N_a and N_i of equation (1-2) are each proportional to the bandwidth. This is while the bandwidth in the numerator of (1-2) cancels with that of the denominator which results in noise figure being independent of bandwidth.
In summery, the noise figure of a DUT is the degradation if the signal-to-noise ratio as a signal passes through the DUT. The specific input noise level for determining the degradation is that associated with a 290K source temperature. The noise figure of a DUT is independent of the signal level as long as the DUT is linear( output power vs. input power is linear).
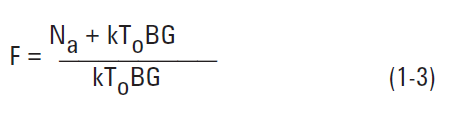
The IEEE Standard definition of noise figure, equation (1-3), states that noise figure is the ratio of the total noise power output to that portion of the noise power output due to noise at the input when the input source temperature is 290K.
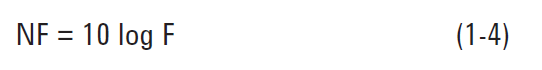
While the quantity F in equation (1-3) is often called "noise figure", more often it is called "noise factor" or sometimes "noise figure in linear terms". Modern usage of "noise figure" usually is reserved for the quantity NF, expressed in dB unites:
Noise figure and noise temperature
Sometimes "effective input noise temperature", T_e, is used to describe the noise performance of a device rather than the noise figure, (NF). Quite often temperature unites are used for devices used in satellite receivers.T_e is the equivalent temperature of a source impedance into a perfect (noise-free) device that would produce the same added noise, N_a.
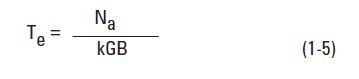
It can be related to the noise factor F
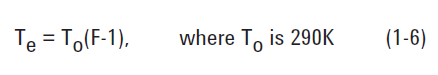
While system performance may be calculated using noise figure without any errors (the 290K reference temperature need not correspond to actual temperature), system designers may prefer to use T_e as system parameter.